DEMO VIEWER
Help
Overview
The EBP viewer shows animated maps depicting the week-by-week distributional patterns of most of the bird species occurring in Europe. Namely, all those regularly and naturally occurring within the EU (477), those introduced that have self-supporting breeding populations (32) and a selection of the more regular vagrant species (58). Species selection and categorization follows the EU Bird List v2024-03-11.
These maps are based on more than 750 million bird records collected since 2010 by the on-line bird recording portals run by the project partners. The data is submitted to the EBP central database repository on a daily basis using the EBP data standard and, therefore, all maps shown in the viewer are also updated on a daily basis using the most up to date information.
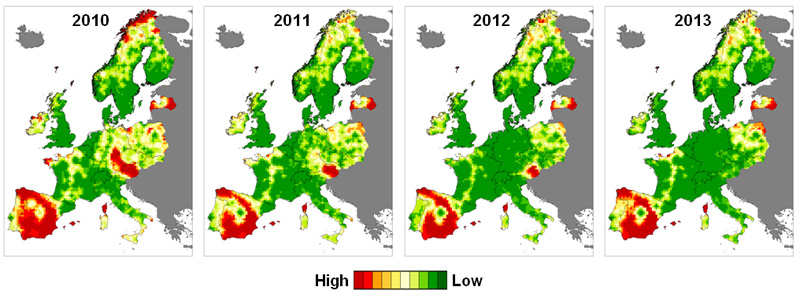
Each animated map depicts 12 continuous months of data (one year) at a resolution of 30x30 km, either the most recent data (LIVE maps), a full calendar year or a split year (July to June). Use the time mode selector to choose among these options.
LIVE maps show the last or the previous last 52 weeks of data and are best suited to see the most recent bird movements (data up to the previous day is provided) and to compare them with the previous year.
Calendar years are better suited to assess the overall seasonal movements of long-distance migrants (European summer visitors) and split years are better for partial migrants. These maps depict data either on a yearly basis (the last two complete calendar and split years area available), combined in periods of six years (to that match EU’s Birds Directive reporting periods) or using the last 15 complete years of data (e.g. 2011-2025).
Currently, there are a total of four types of distributional maps available for each species (see below) and two visualization modes are available: one depicting a single zoomable map and the other one showing a double map (default option). The later allows two animated maps to be shown simultaneously for direct comparison which, given the number of species, types of maps and years available, means that millions different map combinations are available to choose from.
Maps
All species maps show the information aggregated by week and 30x30 km square (based on the European Environment Agency reference grid ETRS89-LAEA) and, in all cases, only those squares including terrestrial areas are depicted.
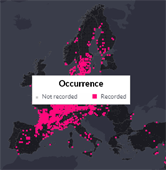
Occurrence map
These maps show the 30x30 km squares where the selected species was recorded or not each week. The area surveyed during the selected time period is shown in black. The absence of records in a given square does not necessarily mean that the species is absent there. Not all detected species are reported, and observation effort varies considerably across the surveyed area. See here for more information on how to interpret the maps.
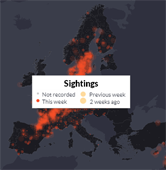
Traces map
These maps show the 30x30 km squares where the selected species has been recorded during each week but also during the two previous ones, enhancing the visualization of rapid temporal changes in distribution and their “traces” over time. The area surveyed during the selected time period is shown in black. The absence of records in a given square does not necessarily mean that the species is absent there. Not all detected species are reported, and observation effort varies considerably across the surveyed area. See here for more information on how to interpret the maps.
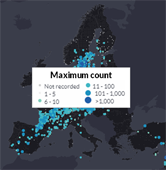
Counts map
These maps show the maximum count recorded for the selected species in each 30x30 km square and week (single year maps) or the average of the maximum count (maps combining several years of data). The area surveyed during the selected time period is shown in black. Note that the original counts used to obtain these figures mostly refer to casual counts or rough estimates of the number of birds detected in a given site and date. Only some refer to formal censuses or exhaustive counts. These maps, therefore, only show a rough approximation of the real variability in bird numbers across space and time. Also take into account that the absence of records in a given square does not necessarily mean that the species is absent there. Not all detected species are reported, and observation effort varies considerably across the surveyed area. See here for more information on how to interpret the maps.
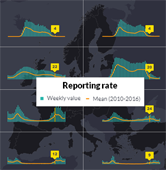
Phenological map
These maps depict the phenology of the selected species in seven different geographical sectors according to the percentage of 30x30 km squares where the species has been recorded in each sector and week. The area surveyed during the selected time period is shown in black.
Data accuracy and interpretation
Each on-line bird recording scheme submitting data to the project has its own data validation protocols to deal with potentially erroneous observations. Moreover, additional data quality checks are conducted at the EBP level. However, overall, the EBP viewer synthesises more than 750 million bird records in thousands of weekly maps. These are too large numbers to completely discard the possibility that some erroneous observations could still be present in some maps. This can be particularly the case in LIVE maps since the data shown can be so recent (e.g. from the previous day) that some erroneous records or counts may not have been detected yet. Once corrected, the system automatically deals with these errors in subsequent data updates. However, the possibility that some erroneous observations could remain unnoticed cannot be completely discarded.
Note also that records of rare species which don't seem unreliable, but which are still under formal revision by the corresponding Regional or National Rarities Committees are also included in the maps. Certainly, some of these records could end up being not accepted by the respective committee. However, the reviewing protocols differ among committees and partners and in some cases the process can take several months and, therefore, not including these observations could artificially alter the seasonal patterns of distribution of these species. In any case, these considerations should always be taken into account when interpreting the maps of these particular species.
The possible existence of some erroneous records or counts, however, shouldn't distort the overall large-scale patterns of bird distribution shown in the viewer, which is the ultimate interest of the EBP project.
Rather than the possible presence of a few erroneous observations, it is the interpretation of the maps itself that requires an important cautionary note. On-line bird recording portals mainly obtain data from the relatively unstructured but intensive and widespread activities of birdwatchers. This means that surveying effort can differ largely from one area to another (even very close ones) or from one week to the next. It is even more relevant that the willingness to report a given species can vary significantly among sites, weeks and the rarity of the species (observers tend to report more often a given species in areas or periods of the year where it is less usual or common). Accordingly, a lack of records of a given species in a given surveyed square and week does not automatically mean that the species was not observed there (it may have been observed but not reported).
In many cases, the advice of an expert and further analyses may be required to draw sound conclusions from these maps. The EBP, therefore, can't be made responsible of the inadequate use of the information contained in the viewer or its interpretation by third parties (see also Disclaimer).
Regarding LIVE maps take into account also that the most recent week depicted, usually the current one (data is updated up to the previous day), may not have finished yet and, thus, special attention must be paid when interpreting distributional patterns of such incomplete weeks (the number of days included is indicated at the bottom-right of the viewer).
For further help to correctly interpret the different maps and graphs shown in the EBP viewer see these instructions.
Data use by third parties
The EBP data repository collects the information provided by the EBP partners on-line bird recording portals using the EBP data sharing standard. The Rules of the EBP data repository establish, in line with the EBP agreement, the conditions in which EBP data can be used to create the products developed for the own interest of the EBP partnership as well as those developed by the request of third parties.
Requests from third parties to use EBP data should be sent to the EBP coordinator indicating the characteristics of the data requested (geographical area, species, type of information and years) and those of the research project (e.g. institutions involved, funding availability, overall objectives and intended use of the EBP data).
Key characteristics of the data available in the EBP data repository:
Time period | 2010 to present |
Geographic coverage | EU member states, Andorra, Israel, Norway, Russia, Switzerland, Turkey and UK. |
Data type | Records (species, count, breeding evidence) with contextual information (e.g. date, location). (cf. EBP data sharing standard for a detailed description) |
Temporal resolution | Date (casual records and part of lists) or date and time interval (part of lists) |
Seasonal coverage | Year-round |
Spatial resolution | Exact location/10x10 km square |
Taxonomic coverage | All bird species occurring in the area covered by the project (see “Geographic coverage”) |
Frequency of update | Data updated daily with information up to the previous day (99% of the data) |
Disclaimer
This website is hosted by the Catalan Ornithological Institute on behalf of the EuroBirdPortal project (EBP), an initiative of the European Bird Census Council (EBCC), a not-for-profit organization located in Nijmegen, The Netherlands.
Using this website requires agreeing with the following:
- The content, information and maps shown in this website are provided in good faith and for informational purposes only. They do not constitute any advice or recommendation in itself and no warranties are given regarding the same.
- EBCC is not responsible for errors that may contain the information provided on this website or the consequences that may result from the use or interpretation thereof.
- The boundaries, colours, denominations or other information shown on maps do not imply any judgement on the part of EBCC concerning the legal status of any territory, or the endorsement or acceptance of such boundaries. Users must observe the copyright and licensing provisions included with all maps.