

SEE lists
Showcasing the value of collecting complete lists in SE Europe
- Home
- Help
- About
- Partners
- Blog
- LIFE EBP reinforcement
 magyar
- Deutsch
- English
- Gaeilge
- Galego
- Lietuvių
- Malti
- Nederlands
- Shqip
- Slovenčina
- Slovenščina
- Türkçe
- català
- dansk
- eesti
- español
- euskara
- français
- hrvatski
- italiano
- latviešu
 magyar
- norsk
- polski
- português
- română
- suomi
- svenska
- Íslenska
- Čeština
- ελληνικά
- Босански
- Македонски
- Русский язык
- Српски
- Українська
- български
- црногорски jeзик
- עברית
Species
464
Complete lists
59.486
Observers
4.427
Historical
Species
583
Complete lists
417.004
Observers
17.462
Loading new data...
Overall changes in reporting rate
(2026)
(2026)
Year-round
Spring
Autumn
vs average
--
--
vs
2024
--
--
Phenology
Phenology across years
Complete lists
2026
2025
2024
2023
2022
2021
2020
2019
2018
2017
2016
2015
2014
2013
2012
2011
2010
2026
2025
2024
2023
2022
2021
2020
2019
2018
2017
2016
2015
2014
2013
2012
2011
2010
Records in complete lists (%)
2026
2025
2024
2023
2022
2021
2020
2019
2018
2017
2016
2015
2014
2013
2012
2011
2010
2026
2025
2024
2023
2022
2021
2020
2019
2018
2017
2016
2015
2014
2013
2012
2011
2010
Observers
2026
2025
2024
2023
2022
2021
2020
2019
2018
2017
2016
2015
2014
2013
2012
2011
2010
2026
2025
2024
2023
2022
2021
2020
2019
2018
2017
2016
2015
2014
2013
2012
2011
2010
Breeding evidences
2026
2025
2024
2023
2022
2021
2020
2019
2018
2017
2016
2015
2014
2013
2012
2011
2010
2026
2025
2024
2023
2022
2021
2020
2019
2018
2017
2016
2015
2014
2013
2012
2011
2010
What's SEE lists?
The overall quantity and quality of the bird data collected in SE Europe is still quite low. For example, relative to its human population, the data collected in this region is about 6 times lower than the European average and several countries in the area are just starting now to develop standard common bird monitoring projects.
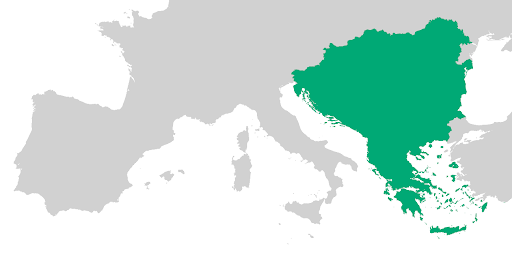
SEE lists aims to contribute to fill up this gap by showcasing the value of the complete lists collected by the online bird portals operating in the target countries of the LIFE EBP Reinforcement project in SE Europe: Albania, Bosnia & Herzegovina, Bulgaria, Croatia, Greece, Hungary, Kosovo, North Macedonia, Moldova, Montenegro, Romania, Serbia and Slovenia.
The viewer has three main sections, all of them updated every day with the data collected up to the previous day by the different online bird portals (see here to know more about the EBP data flow system).
At the top, you can see the overall statistics in terms of the number of species recorded, complete lists submitted and observers contributing data. Next, there is the main section of the viewer, where you can see the information at the species level (you can select the species of interest from the drop-down menu) and, finally, on the right, there is the section that shows how data collection and participation has progressed in the area over the years.
Information at the species level
Overall changes in reporting rate
These indicators show the percentage change in reporting rate (% of complete lists with the species) of the year of reference (by default it is the current year but can be changed using the drop-down menu) in comparison with the historical average (2010 up to now) and the value for the previous year. When the current year is selected, given that it will usually still be in course, only the data for the same time period across all years is considered. For example, on April 25, all reporting rates (both for the year of reference as well as the previous year and the historical average) are calculated for the period that runs from January 1 to April 24.
Phenology
Shows the year-round variation in the weekly reporting rates for the year of reference, the previous one and the historical average (2010 up to now). The first week of the year begins invariably on January 1, so weeks do not necessarily go from Monday to Sunday (hover over the values in the graph to see which days are included in each week).
The year-round variation in the reporting rates denotes the overall seasonal pattern of occurrence of the selected species (for example, the time when a migratory species arrives and leaves SE Europe) but can also be influenced by seasonal changes in detectability. For example, many species have lower reporting rates after early summer, once they stop singing, but this does not necessarily mean that their presence has diminished.
Given that the data are updated daily, it is necessary to take into account that the reporting rate of the current week will not always have been calculated with the data for the entire week and, therefore, it may not yet be representative enough.
Phenology across years
Shows the variation in reporting rates by month and year (from 2010 to the current year).
This is especially useful to see eventual changes in the overall phenological patterns across time. For example, to see if a given species is becoming more or less frequent over the years or at certain time periods (e.g. winter). It is also very useful to see which years have been especially good for irruptive species. Like the previous graph, however, it is necessary to keep in mind that the changes in reporting rates can also be affected by seasonal changes in detectability or due to changes over time in the areas or habitats covered by the observers.
Given that the data are updated daily, it is necessary to take into account that the reporting rate of the current month will not always have been calculated with the data for the entire month and, therefore, it may not yet be representative enough.
Progress indicators
Given that the current year will usually still be in course, you can choose to see the results of these indicators filtered for the same time period across all years (e.g. on April 25, using only data from January 1 to April 24) or including the whole data (i.e. using the data of the entire year in all cases except for the current year).
Complete lists
Shows the progress in the overall number of complete lists collected in the region over the years.
Records in complete lists (%)
Shows the progress in the percentage of records collected within complete lists in the region over the years.
Observers
Shows the progress in the overall number of observers submitting complete lists in the region over the years.
Breeding evidences
Shows the progress in the overall number of breeding evidences reported in the region over the years.
What's a complete list?
A complete list is the list of all bird species that a given observer is able to identify in a given place and time period.
Only very rarely all bird species present in a given place and time period will be detected even by the most skilled observers (e.g. some birds will always be completely quite or out of sight), therefore, it’s perfectly normal for complete lists to only contain some of the species that are regularly seen in a given place and time period.
Why are complete lists so valuable?
Unlike casual observations, complete lists not only contain information about the bird species that have been detected, but also about those that have not been detected. In other words, they give much more valuable information because knowing where birds aren’t detected is just as important as knowing where they are!
Thanks to this, complete lists are particularly helpful when trying to understand the patterns of bird distribution across space and time or to study phenological patterns and their change over time.
The phenological patterns shown in this viewer are just one of the many interesting outputs that can be provided thanks to complete lists.
How could I start to collect complete lists?
Tip 1: Start making complete lists in areas with fewer bird species and more familiar to you (e.g. your garden, a local park).
Tip 2: Start making lists of short duration (e.g. 15-30 minutes).
How can I make my complete lists even more valuable?
Tip 1: Do not move more than 1km (the bigger the area you cover the less valuable the data). If you are hiking or covering longer distances, make complete lists only of some of the areas you will travel through.
Tip 2: Do lists of up to 1, maximum, 2 hours. As a rule of thumb, the shorter the duration and the distance covered, the more valuable the information collected.
Tip 3: Provide always counts for all the species observed, even if they are very rough. It is much better to indicate an extremely rough count than just presence.
Tip 4: If the app associated with your portal allows this, always record your GPS track!
Tip 5: Record any observed breeding evidence.
Tip 6: Collect complete lists all year-round. All seasons of the year are equally interesting!
EBP Partners in SE Europe













Online portals operating in SE Europe










Find out more about the other two main EBCC projects
Funded by the European Union. Views and opinions expressed are however those of the author(s) only and do not necessarily reflect those of the European Union or the European Commission. Neither the European Union nor the granting authority can be held responsible for them.
Copyright © - EBCC 2015 - 2026 - All rights reserved
Copyright © - EBCC 2015 - 2026 - All rights reserved